When it comes to evaluating how likely you are to have a heart attack, the most accurate diagnostic—the gold standard—is the calcium score. The reason why it’s the most accurate is because it’s calculated from an actual 3D image of the heart and the blood vessels around it. A computerised tomography (CT) scan is done, and from it the amount of plaque buildup in all the places where it appears because of the high density of the calcium it contains is measured and summed to give the total calcium score.
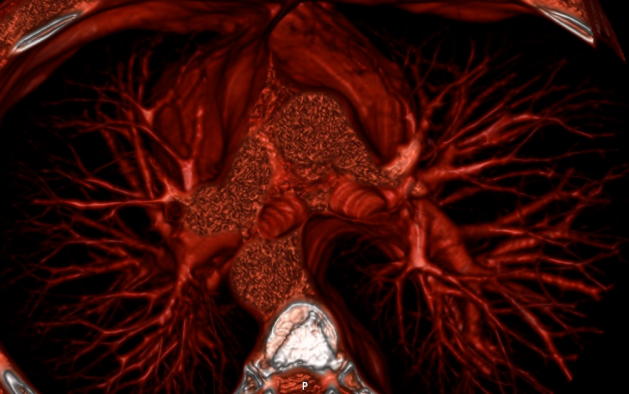
3D volume rendering of my heart seen from the top.
Even though it has been estimated that approximately half of heart attacks are caused by non-calcified lesions, this is the closest thing we have to a direct measurement of the amount of plaque in the network of arteries around the heart. From doing this to thousands of people, we know that plaque usually begins to accumulate after the age of 35. Why isn’t the calcium score test done systematically on everyone above 40 in order to assess their immediate risk, but also to track their individual cardiovascular evolution, showing, with a reliable reference each year, how quickly or slowly arterial plaque is growing? Because it’s too expensive. Therefore, it’s only prescribed to people who are deemed to be at high risk based on other so-called “risk factors”. You know the list: overweight, sedentary, smoking, stressed, etc. But the clincher in this list of risk factors, the one factor that has pretty much eclipsed all the other ones, at least for the past few decades, is high cholesterol.
The focus on cholesterol was, over time, shifted to LDL, the “bad” cholesterol, and later on the ratio between it and HDL, the “good” cholesterol, terms introduced by the pharmaceutical industry to convince us that there is a battle between a good guy and a villain that must be stopped, which they can help with by providing us cholesterol lowering statins, even if with each passing year, the evidence exonerating cholesterol and lipoproteins from any wrong-doing in the genesis and progression of cardiovascular disease has been accumulating. Still, for people and for doctors, it’s really hard to overcome the several decades of conditioning we’ve suffered holding cholesterol as the main culprit for heart disease.
Fortunately, this knowledge and information have been shared and available for as long as the first experiments that set us on this damning direction in thinking and mindset. For my part, I first read a clear expose on the function of cholesterol and lipoproteins from Ron Rosedale over 10 years ago. Then I read it from Uffe Ravnskov, then from Anthony Colpo, then from Malcolm Kendrick who has and to this day continues to investigate the topic and share his findings on his blog, and then from Gary Taubes. All of this has taught me that cholesterol, HDL, and LDL, are not only not dangerous, but that they are essential and crucial for optimal health. This, I shared with you in But what about cholesterol? and shaped my diet to maintain healthy levels: I restricted carbohydrates and polyunsaturated oils, and have gotten most of my calories from minimally processed saturated fats from grass fed animals fats, coconut oil, butter, and olive oil. In this endeavour to maintain strong cholesterol and lipoprotein levels, as you can see below, I have succeeded.
The following plot shows all the measurements of total cholesterol I have ever gotten made from blood tests over the past decade. What you can see is that in late 2007—a time before which I ate mostly complex carbohydrates and polyunsaturated seed oils while avoiding animal and saturated fats—my total cholesterol was below 150 mg/dl. Since then, it has been generally around or above 200 mg/dl with a slight upward trend over the years.
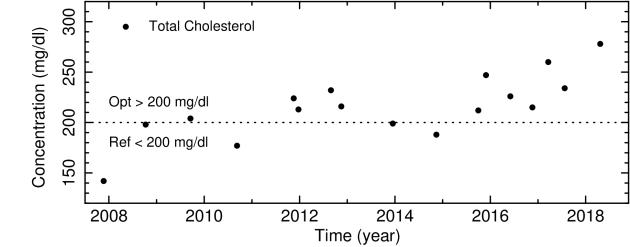
My own total cholesterol levels in mg/dl measured from late 2007 to mid 2018.
If we look at the concentration of low and high density lipoproteins LDL and HDL, we also see consistently high levels, with LDL typically 10-30 mg/dl higher than HDL levels. Unsurprisingly, the same general shape and trend are is seen in these measurements as are seen in those of the total cholesterol.
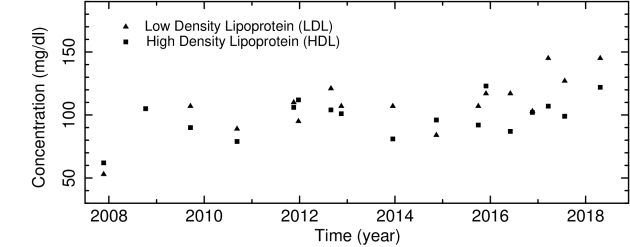
My own LDL and HDL levels in mg/dl measured from late 2007 to mid 2018.
Many of you have been reading this blog for a while, and I trust that you have therefore also known for a while that cholesterol is good for you, and that we should strive to have robust levels of HDL, LDL, and total cholesterol. Whether you have managed to overcome the conditioning we have all been subject to over our lifetimes about the purported but never-substantiated dangers of cholesterol and saturated fats, I cannot know. But I hope that I have at least helped a little in that respect.
In any case, I have for several years, every since I first read about the calcium score, wanted to get this test done, and see where I actually stood on the arterial calcification scale. I’ve never had fears or apprehension about it because even when I first read about it, I felt that I had a pretty good idea of the process by which cardiovascular disease evolved, and was following a regime that I knew would minimise the likelihood of atherosclerosis. But still, there is a big difference between having confidence that something is the case, and actually knowing that it is by seeing observational, quantitative, measured evidence for it. Finally, this spring, I was able to get a calcium score done.
I was very lucky to be referred to a young (45), well-informed, and open-minded cardiologist who also does research and has led trials on a group of several thousands of people who work at the Santander Bank campus near Madrid. He also happens to be the head of the cardiology imaging unit of the Clinical Hospital San Carlos in Madrid, a post he has held for more than 6 years now. So, he’s not just any cardiologist: he’s one of the best, and most importantly, one of the very best in cardiology imaging, which was exactly the purpose of consulting with him in the first place. I could not have been in better hands.
On our first appointment, after the initial conversation and questions regarding medical and health history, his assistant helped do an ECG, which looked “perfectly normal”, he said. Then he did the ultrasound with Doppler imaging that allows to see the heart pumping and the blood flowing with a colour coding of red and blue for the blood flowing away and towards the probe. To the trained eye of the imaging cardiologist, the Doppler ultrasound shows how the heart moves, how the cross-sections of the arteries pulsate with the heart beats, how the valves open and close, how flexible the tissues are, and how impeded or unimpeded the flow is. After a thorough examination, from one side and then from the other, he said everything looked very good.
At the end of the appointment he wrote a prescription for the CT scan to be able to get my calcium score, and another for a set of blood tests to which he willingly allowed me to request any additional one I wanted to have done. Before leaving the clinic, the assistant was able to arrange to have the blood test and the scan on the same day one week later: the blood test would be done in house first thing in the morning, and the scan would be done afterwards at the best medical imaging facility in the city.
The day before the scan, I read up on the test, how it’s done, how the measurements are made, and what the score means. I found out that, first, that the measuring of the amount of plaque buildup was done by eye, meaning that the experience and know-how of the cardiologist doing it was quite important. Second, I found out that the scale was not normalised like a scale from 1 to 10 or 0 to 100; that it was from 0 to whatever, which could be 400, 1000 or 4000. Although I was surprised and a little disappointed at first—we all love to get a score that can be immediately compared to everyone else’s, and gives us a sense of where we stand with respect to the rest of the population—I quickly realised that this made good sense given that it is not a relative but instead an absolute measure of plaque buildup in the arteries: naturally, this can go from no plaque to a little bit, to a lot, and to a ton of plaque. One could imagine estimating a maximum amount—say the amount needed to completely fill up the arteries—and use that as the normalising factor representative of 100%, and expressing every other result with respect to this. For now, this hasn’t been done, and the guidelines for interpreting your calcium score suggest values as follows:
- 0 — No identifiable plaque. Risk: Very low, generally less than 5 percent.
- 1 – 10 — Minimal identifiable plaque. Risk: Very unlikely, less than 10 percent.
- 11 – 100 — Definite, at least mild atherosclerotic plaque. Risk: Mild or minimal coronary narrowing likely.
- 101 – 400 — Definite, at least moderate atherosclerotic plaque. Risk: Mild coronary artery disease highly likely, significant narrowings possible.
- 401 or Higher — Extensive atherosclerotic plaque. Risk: High likelihood of at least one significant coronary narrowing.
I got the blood test results back before the calcium score: everything looked good. Because most of my blood markers have been stable for years, especially the metabolic markers related to glucose and fat metabolism, the ones I am most interested in are those I need to monitor: things like B12, folate, homocysteine, and D, all of which need to be controlled and their levels adjusted with supplements; those that show my hormonal status, especially for the thyroid and sex hormones; and finally the markers of systemic inflammation which should always be as low as possible. The cholesterol panel is the one that for me has the least importance. But we are here considering cholesterol and lipoproteins in relation to cardiovascular risk assessed by means of the calcium score. So, these were the measured values: total cholesterol was 278 mg/dl, HDL was 122 mg/dl, LDL was 145 mg/dl, VLDL was 11 mg/dl (ref: <40), lipoprotein(a) was 4.40 mg/dl (ref: <30), and the ratios of total/HDL and LDL/HDL labelled atherogenesis indices were 2.28 (ref: <4.5) and 1.19 (ref: <3.55), values which are all deemed very good, of course.
A few days later I got my calcium score back. What do you think it was? You know I’m currently 45 and that calcification begins to grow after the age of 30-35, and has definitely progressed by the age of 40. You also know that—from what we are told by most doctors and health authorities—that plaque buildup and calcification is an inevitable part of ageing, that no matter what we do or eat or not eat, even if we might be able do things to slow it down, plaque accumulates and calcification progresses in only one direction: upward and onward. With this in mind, what would you guess my calcium score was?
My calcium score—based on 3D imaging of the heart and the region around it, and calculated by the one of best imaging cardiologist in Spain—was 0. It wasn’t 10 or 20. It wasn’t even 1, or 2, or 3. It was zero.
In our scientific training we learn that theories can never be proven—that they can only be disproven, and that hypotheses can never of accepted—that they can only be rejected. We also learn that to disprove or reject a theory or hypothesis, what is needed is a single contradicting piece of evidence, a single contradicting observation. The lipid hypothesis—that elevated blood cholesterol leads to atherosclerosis of the arteries, and that therefore decreasing blood cholesterol concentration significantly reduces cardiovascular risk—has been ingrained into our psyche more solidly than almost anything else that we collectively believe. But faced with this evidence, even if it is from one person only, of having maintained “elevated” fasting cholesterol levels consistently for a decade while in spite of this having gotten a perfect calcium score at the age of 45, the hypothesis must surely be rejected.
Even if we didn’t have any other evidence at all, according to the scientific principle that one contradicting piece of evidence is sufficient to reject a hypothesis, this single instance of my history of high total cholesterol together with a calcium score of zero is enough to reject the hypothesis that having elevated blood cholesterol levels over a long time leads to atherosclerosis and therefore to cardiovascular disease.
And we can be sure I’m not the only one. In fact, I’m willing to bet anything that most people in the low carb community who have been low carbers for as long as I have will have high cholesterol levels and low calcium scores. But still, to change the mindset of several generations of doctors, journalists, and people everywhere—hundreds of millions of educated people conditioned from decades of misinformation—will take years, probably decades. That’s how we are as social animals: stubborn in our beliefs.
In any case, I hope you, at least are, if you weren’t already, are now convinced that having high cholesterol does not cause atherosclerosis. Are you now curious to find out what your calcium score is? If you do get it done, please share.
For my part, I feel even more confident than I did. Even if I assured you more than five years ago in the spring of 2013 in At the heart of heart disease that you could be entirely free from cardiovascular disease by following some basic guidelines I listed regarding our eating, drinking, and living habits, there is nothing like observational evidence. And now we have it.
Thank you to all our patrons, and in particular Eric Peters, for their continued support. Become a proud sponsor of healthfully and join our patrons today!

Excellent news, Guillaume! I’ve heard about the Calcium score test some time ago (Ivor Cummins and “The Widowmaker” docu), however for me here in Ontario it’s not available (unless perhaps a Cardiologist orders it?)… :-(
LikeLiked by 1 person
So cool, Guillaume. Thanks for sharing. And just a quick question — your thoughts on goat’s cheese? My neighbor just gave me 5L and I make fresh goat’s cheese. Thanks. 🙏🏻☺️
LikeLike
You’re lucky! As long as it’s fresh and not pasteurized, and you are not intolerant to it, then all is good.
LikeLike
Hi again — thanks, Guillaume. Yes, it’s fresh — he brings it right over, so it’s actually still warm. Now he’s going to teach me to do it, so I can go over when I like. 🌿 Yes, I’m lucky. ☺️ Take good care, and thank again for all you do. 🙏🏻
LikeLike
Congratulations. From looking at your ratios, I had no doubt you’ll score 0 or close to in a CT. Keep on!
LikeLiked by 1 person
Fantastic!
I might do the calcium score test one day, however, thanks to you, I don’t think I need to go through the trouble. I’m confident that my score, if not zero, is very close to that perfect mark of yours and that, consequently, my risk of adverse heart conditions is very low, though being 7 years older than you.
In about five years since I started following your blog and maintaining a strict low-carb, high-fat diet my total cholesterol increased from 90 mg/DL to 133 mg/DL (7.2 mmol/L). This is still half your cholesterol levels but I learned reading your blog that it often takes years before the body is able to get back to its perfect natural state.
Thanks again, Guillaume. Your observational evidence is the only proof I need to consider the lipid hypothesis rejected!
LikeLiked by 1 person
This is well and fine but….
I have a calcium score of zero but have had two strokes. My LDL particles was very very high. I had a PLAC test – several times in two years – and am in the high danger area.
You do not list a PLAC test as one of your tests
CAC does not pick up very small levels of plaque or plaque in the rest of your body
CAC cannot becfone frequently
I suggest you have a look at the PLAC test.
LikeLiked by 1 person
Thanks for sharing that! Have you read the articles on vitamin K2? And At the heart of heart disease? Let me know what you think when you do.
LikeLike
I have read on K2 as I take it with Vit D. ( https://www.ncbi.nlm.nih.gov/pubmed/21155624 ) Have you looked into PLAC? https://journals.lww.com/nursing/Fulltext/2006/08000/Gauging_cardiovascular_risk_with_the_PLAC_test.13.aspx
My PLAC was ‘High’ and small LDL was 1000% higher than the range BUT my CAC was zero. 6 months later I had a stroke
LikeLiked by 1 person
Thanks for that Christopher.
LikeLiked by 1 person
No comment on my PLAC comments then
LikeLike
I need some time to read up on it.
LikeLike
WOW, Christopher! Hope you fully recovered from the stroke – but that’s very interesting information you shared. After watching Ivor Cummins’ YouTube I thought the CAC Test was the fool-proof test for CVD. Now I’ll have to look into the PLAC test – Thanks for your post!
LikeLiked by 1 person
Hi again Chris, I read the short article you linked above, and emailed my cardiologist to ask if we can get this done here in Spain. If so, I will get it done in my upcoming yearly blood tests, and let you know what else I can find out and say about it. My feeling is that if it a measure of inflammation, that would also have been brought to light by measuring CRP, Sed rate, Lp(a), and Hcy, which I recommend.
LikeLike
FYI I was very low (good) on all of those and super high on PLAC.
LikeLike
Would you mind sharing your values for the above-mentioned markers?
LikeLike
OK here goes…
Oct 2016 is 262.6 nmol/min/mL – high risk
Reduced risk: <225
Increased risk: >225
Note: TIA in March 2016
Feb 2018 is 759.4 U/L – high risk
Low risk <560 U/L
Intermediate Risk 560-619 U/L
Borderline Risk 620-634 U/L
High Risk >635 U/L
Note: minor stroke May 2018
June 2018: 692.2 (High risk)
(CRP = 0.6)
CAC score ZERO in mid 2018
Lab analysis report as the units differ:
The clinical cut offs are designed to be a measurable value which distinguishes positive from negative results. As with any biological assay there is always variation. A significant amount of trial and scientific study has gone into the cut off value for each section. The i-plaq results are divided into Intermediate Risk (560-619 U/L), Borderline Risk (620-634 U/L) and High Risk (>635 U/L) in order to aid clinicians on the treatment approach for patients. The plactest results have a different unit of measure which is less sensitive, linear and has a smaller range, therefore the values are lower. As a result they have used a single pos/neg cut off of Increased risk (>225). It important to note that although these values are different they do correlate with the vascular inflammation within the patient.
With this in mind both sets of results indicate that the patient is High Risk. Thus meaning that there is active inflammatory process/disease within the vascular system of this patient. As a result treatment should be pursued with a view to lowering this level. Based on both results there is an increased risk of cardiovascular disease and plaque rupture. If you are looking into the values themselves to see if there has been any improvement, although the values are different, they both are in the High risk category and as a result the situation is the same. Please see the clinical report and patient information flyers attached. Based on the data we have in scientific journals and studies in order to deem that the vascular inflammation is improving clinicians would need to see the i-plaq level lowering through the Borderline Risk range of 620-634 U/L and into the Intermediate Risk range of 560-619 U/L. The risk is proportional to the score, so the lower the result the lower the risk.
&&&
The treatment discussed was:
niacin
Omega 3 supplementation
But especially statins
(as well as lifestyle such as weight loss, exercise, stress reduction etc)
By far – according to the studies sent – the most effective was …statins.
I have another PLAC test in May 2019…as i am not taking statins I need to try and ensure the other methods are working….
Also see:
https://www.thelancet.com/journals/lancet/article/PIIS0140-6736(10)60319-4/fulltext
and
https://www.ncbi.nlm.nih.gov/pmc/articles/PMC4620072/
“….which led the authors to
conclude that the reduction of Lp-PLA2 during treatment
with statin was as predictive, or even more predictive,
than the decrease of LDL cholesterol[74]: about 59%
of the beneficial effects of pravastatin were explained
by a decrease of Lp-PLA2 values. “
LikeLike
What about sed rate, Lp(a), Hcy?
LikeLike
Lp(a) 0.14 (low)
Homocysteine: 11.5 – high but not incredibly so
ESR not done
Sed rate, or erythrocyte sedimentation rate ( ESR ), is a blood test that can reveal inflammatory activity in your body. A sed rate test isn’t a stand-alone diagnostic tool, but it can help your doctor diagnose or monitor the progress of an inflammatory disease.
So if i had NOT had PLAC test done, especially with the CAC result, I’d have thought all was super fine…
LikeLiked by 1 person
So basically everything looked normal, except for PLAC, and you did have a stroke. It’s compelling. I’ll follow up when I hear back from the cardiologist.
LikeLiked by 1 person
But there’s more
I am in top 97% risk of heart attack owing to LDL-P being 2600+ That’s from 2017 and yet 2018 calcium score zero
LikeLike
I’m following this with great interest! Thank you.
LikeLike
My previous post should say top 3% not 97% sorry
LikeLike
I’m looking forward to further comments on the topic, I never knew about LDL-P. I’m pretty sure this test won’t be readily available to the public.
LikeLike
You may like this….
Ldl-p in the U.K. is widely available if you pay….
LikeLike
Peter Attia, MD, posted this info about CAC-scores on a podcast (and a transcript). I hope the link will transfer okay so it could be opened (as I am a bit computer-challenged…) https://peterattiamd.com/ama05/
LikeLiked by 1 person
I’m in Ontario. I’ll ask my ND – they are allowed to order some specialized tests, but by far not all the ones which are available to a Cardiologist, for example. And in order to get to be seen by a Cardiologist, I need a referral (with a legit complaint) by my Family doctor (GP).
LikeLike
Essential take home message: “Studies indicate that these patients may benefit most from low-carbohydrate diets and that carbohydrate restriction reduces LDL-P.”
LikeLiked by 1 person
Also, very importantly, do not get a false sense of security from a calcium score…
https://peterattiamd.com/ama05/
LikeLiked by 2 people
BTW, have you read this one? https://healthfully.net/2018/02/03/ten-years-of-carbohydrate-restriction-why/
LikeLike
Any updates on my PLAC comments?
LikeLike
Waiting for the results.
LikeLike
Hi Chris, I got the results: my Lp-PLA2 (for everyone else: lipoprotein associated phospholipase A2) is 156.8 ng/ml.
LikeLike
Also for everyone else: https://www.lifeextension.com/magazine/2008/11/detect-risk-of-sudden-heart-attack-stroke/page-02
LikeLike
Firstly fantastic you followed up my suggestion. Great. Secondly fantastic results! Mine retested have worsened despite vastly improved Omega 3 ratio. But I have been eating a lot of muesli…
Ok I will re-read your blog and see how you did it… at a guess you’re considerably younger than me….
LikeLiked by 1 person
46.5, you?
LikeLike
64…and I wish I had done the PLAC test years ago. Thankfully I didn’t rely on a calcium score of zero – if I had my PLAC score would have been even worse!
LikeLiked by 1 person
Recently read about TMAO (Trimethylamine-N-oxide), a gut metabolite which apparently, when elevated in the blood, is a major predictor of heart disease. Dr. Mercola states that “High TMAO Is a Potent Predictor of Early Death” (“Probiotics May Lower Your Risk of Heart Attack and Stroke”). So maybe – as can be expected – the picture is more complex…?
LikeLiked by 1 person
By the way…. I know of a course about strokes on Udemy. It is not free BUT I contacted the neurologist who runs it and he has given me plenty of free passes. I am NOT posting it here as it might be seen as marketing or abuse of discussion or something but the course is free, is run by an American neurologist and importantly he DOES answer questions. I have posted 35 so far! (I have no connection to him or the course except I am enrolled on it)
LikeLiked by 1 person